
|
|
posted: December 16, 2023
tl;dr: You can never know the true winner of an A/B test, but you can get significantly close...
The most viewed sporting event in the United States of America is the Super Bowl. The game starts with a coin flip. To commemorate the event, the National Football League (NFL) mints a special coin, with one team getting the ability to call heads or tails and then choose something if the coin comes up their way. Surely the NFL does everything possible to ensure that the coin is a fair one, i.e. an exactly equal probability (50%) of coming up heads or tails. How many times do they flip the coin after manufacturing it to ensure it is fair?
If a perfectly fair coin is flipped ten times and the number of heads (or tails) is counted, the possible results will follow the probability distribution curve just below. Five is the most likely outcome, but it will only occur a little bit more than 24.6% of the time as the ten coin flip experiment is repeated. Six or four will occur nearly as often, at a bit more than 20.5% of the time for each. Nine or one will occur almost one percent of the time for each. Clearly flipping a coin just ten times is insufficient to determine if it is a fair coin, as there is a greater than 75% chance that the result is a number other than five.
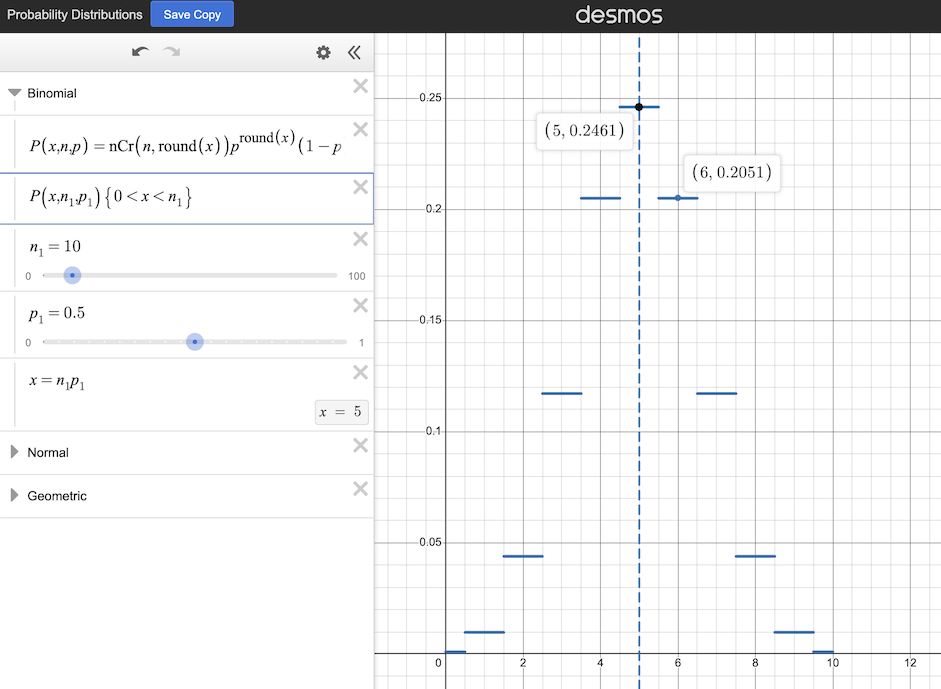
The probability distribution of the result of flipping a fair coin ten times (source: Desmos.com)
What if the experiment is changed to flip the coin one hundred times? Now the possible results will follow the below probability distribution curve. The odds of getting the central value, fifty, decrease to a little under 8%, but the other likely values cluster more closely to the central value. The odds of getting heads (or tails) on sixty out of one hundred flips are just over 1%, in comparison to the 20.5% chance of getting six heads (or tails) out of ten flips. This trend continues as the number of coin flips in the experiment is increased further.
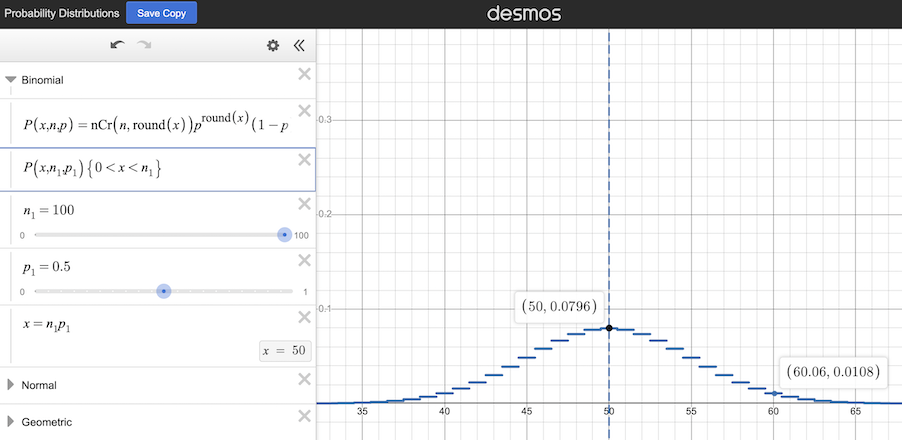
The probability distribution of the result of flipping a fair coin one hundred times (source: Desmos.com)
Would one million coin flips be enough to determine if a coin is truly fair? It would be next to impossible to get 600,000 heads for one million flips, as the results will cluster closely to the central case of 500,000. If you do indeed get 500,000, you might be tempted to declare the coin fair. But what if you get 500,001? Or 499,990? Does that mean the coin is slightly unfair and is weighted towards one particular outcome, heads or tails? Or is it actually a fair coin, and the observed results are just due to random variance in running the experiment?
You don’t know. You can never know. There is no finite number of flips that you can use to determine if a coin is absolutely fair. There is an element of randomness at play in the experiment.
Hopefully this example has illustrated several “facts of life” about probabilistic experiments of events (such as a coin flip) with two possible outcomes:
Flipping a coin to determine if it is fair is actually a type of A/B test. You can consider the “A” case to be a perfect, theoretical coin, with exactly a 50% chance of coming up heads or tails. Case B is the actual coin you are measuring to determine if it behaves the same as the A coin, or if it is more likely to come up heads or tails.
A more typical type of A/B test is the kind we run at my employer, Evoke Melt. We run A/B tests on emails that we create, sending out two versions of an email to randomized halves of a distribution list, and then measuring how many times the emails are opened or a link in the email is clicked. We can display two different versions of a web page to users on a purely random basis, and measure how many clicks or other user interactions each version produces. We can deploy two different versions of a banner ad, and measure the click-throughs that each produces. When we do so, some of the questions that arise are:
Running this type of A/B test is like flipping two coins of unknown quality or probability, each of which might be heavily or lightly weighted towards one particular outcome. If the A and B versions vary dramatically in how users interact with them, it might be possible to declare a winner quickly. For example, imagine two versions of an email, one with such a terrible subject line that no one in a sample size of ten opens it, and another with such an enticing subject line that all ten open it. There’s a small chance that the true open rate (or probability) of each email is 50%, and the first email happened to be very “unlucky” (no one opened it) whereas the second email happened to be very “lucky” (everyone opened it). But those odds are very small, so it might be possible to declare the second email to be the better email even with such a small sample size. Still, there’s a non-zero chance of being wrong.
It’s more typical that the two versions vary slightly in how users interact with them. One email (A) might have an actual open rate (or probability) of 48%, whereas the second (B) has a probability of 52%. Again, the actual open rate can never be known exactly. When the A and B versions are similar,many more samples will be needed in the experiment. Eventually, the results for A will move towards a value close to 48%, and the results for B will move towards a value close to 52%. Eventually, there will be enough samples that the chances of the observed difference between A and B being due to randomness in the experiment are low enough that B can be declared the winner. A 95% confidence level is often used to declare a “statistically significant” result, which means: there is less than a 5% chance of the observed difference in the experiment being due purely to probability distribution. But even at 95% confidence level, there is still a 5% chance of being wrong. If you want a higher confidence level, you have to take more samples.
When running an A/B test, the experiment size cannot be known in advance. The closer the A and B versions are in terms of their measured results, the more samples are needed to differentiate between them and achieve a statistically significant result.
Related post: The significance of statistics, and probability