
|
|
posted: March 7, 2020
tl;dr: Data visualization tools can solve one of the problems with spreadsheets, namely stale data...
Spreadsheets are more problematic than most users realize. I consider them to be on the verge of becoming archaic, although this is probably wishful thinking. As a programmer, I prefer programmatic solutions for data analysis tasks. Not everyone thinks of themselves as a programmer, however, or wants to.
One of the problems with spreadsheets is stale data. As soon as data is put into a spreadsheet from whatever the original source of the data happens to be, it becomes static and can easily fall out-of-date. Even if the data is entirely from the past, that historical data may contain errors that need to be corrected or adjusted in the future. Unless absolutely everyone using the data considers the spreadsheet to be the “source of truth”, and unless everyone accesses the exact same spreadsheet (and not different copies of it), you end up with data aging, consistency, and accuracy problems.
There is a class of tools that solves this one particular problem (but not others) with spreadsheets: data visualization tools. Sometimes these are called “business intelligence” tools, but I consider that latter term to be an exaggeration and less descriptive of what the tools actually do.
Spreadsheets contain features to build graphs from the data in a spreadsheet. Data visualization tools also allow users to build graphs, but the data can come directly from databases and many other sources of original data, including spreadsheets and other files, such as Comma-Separated Value (CSV) files. As the data changes, either due to the addition of new data or changes to existing data, the visualizations built from the data are updated in close-to-real-time, without intervention from the user.
I’ve been using three data visualization tools recently at work: Tableau, Google Data Studio, and Amazon QuickSight. I’ll compare and contrast them later in a separate post. Tableau was recently acquired by Salesforce, at a price rumored to be over $15 billion. Another tool is Looker, recently acquired by Google Cloud for $2.6 billion. There is some serious money being put to work in this marketspace.
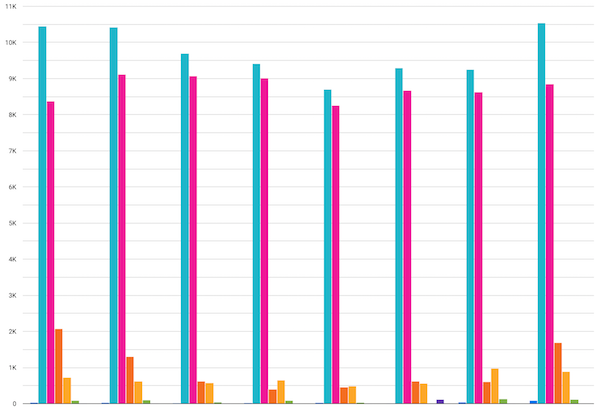
If the data is up-to-date data, the conclusions drawn from a graph are more likely to be correct
These tools come with a large number of connectors to a wide variety of different proprietary databases and other data warehouses, from a large number of vendors. Often these are SQL databases, but many non-SQL database technologies are supported too. Data can also come from spreadsheets, files, and APIs. To build a visualization, you choose the appropriate data connector and enter the configuration information to connect to the source of the data. Data can either be queried in real-time each time the visualization is drawn, or it can be extracted from the source on a scheduled basis and stored within the data visualization tool.
The primary challenge in using these tools is building up the exact data to be visualized on a graph. For anything other than a trivial graph built from a small data source, the data often needs to be joined together from multiple tables or sources, filtered, de-duplicated, aggregated, and cleaned up. In effect you have to build a new, single table of data, which is then fed into the tool’s visualization engine. The name of one of the leaders in the space, Tableau, conveys this concept, as “Table” is the first 5 of the 7 letters of the name “Tableau”: Tableau allows you to visualize a table of data. That’s what all of these tools fundamentally do.
The most common data source for these tools, in the business world, is table-oriented SQL databases. The data visualization tools contain graphical editors to allow multiple SQL tables to be joined, in the hopes of creating a single table that can be visualized. I find these SQL graphical editors to be a hindrance rather than a help: it is more efficient for me (and anyone who knows SQL) to write a custom SQL query to build the table to be visualized. By putting all the data processing in the SQL layer, it simplifies what needs to be done later when building a visualization. It also produces a SQL query that can be cut-and-pasted into other data analysis tools, such as the Python data science stack for programmatic data analysis. SQL isn’t a great tool for data analysis, but it is ubiquitous, albeit with multiple variants.
Each data visualization tool has its own custom language for doing additional data analysis, just as spreadsheets do: see Reinventing the wheel: IF statement edition for how each tool implemented the humble IF statement. If you do most of the analysis at the data source layer (e.g. in SQL), you’ll be less dependent upon learning and using a vendor’s custom language.
The tools provide a wealth of different graph formats for visualization. They have some intelligence which looks at your data source and determines which types of graphs might apply, letting you choose between that subset of all graph types. Individual graphs or visualizations can be pieced together to form a dashboard. Dashboards and reports can be distributed to other people via various means.
Active controls such as filters and data range pickers can be placed in the visualizations. This allows other users, besides the person who created the visualization, to do further analysis by interacting with the data. Creating a visualization from raw data sources, however, does require more technical knowledge than the typical spreadsheet user possesses. It’s necessary to know how to configure the connections to the data sources, how to query the data, and how to prepare it (either at the SQL database layer or within the tool’s custom language) for visualization.
While data visualization tools solve the issue of stale data in spreadsheets, other problems persist. The data in a visualization is separate from the code, but the code is spread around in multiple locations, just as it is in a spreadsheet. Some of the code resides at the SQL layer, and some of it resides within the visualization’s configuration and is written in the vendor’s proprietary language. There’s no one place to go to be able to see all the code that creates a given visualization. Because the code is hard to see, review, and test, subtle errors can creep in unnoticed.
Data visualization tools ensure that the data is fresher and more likely to be correct, but they do not cure all the ills of spreadsheets.
Related post: Spreadsheets (arch.)